From MdsWiki
jScope is a MDSplus tool providing a sophisticated graphical interface to acquired waveforms.
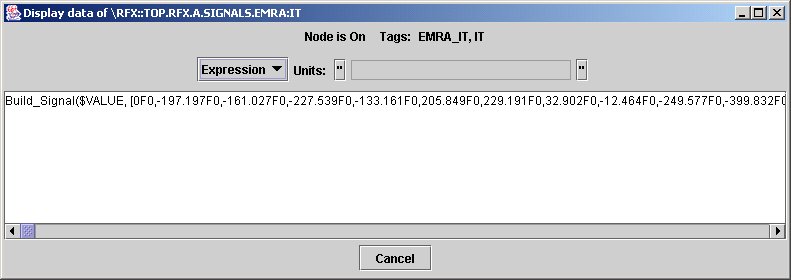
We know now that a MDSplus tree can contain several kinds of data, among which arrays and signals. If we use jTraverser to look at the content of a node containing an acquired signal, we would see something like the following:
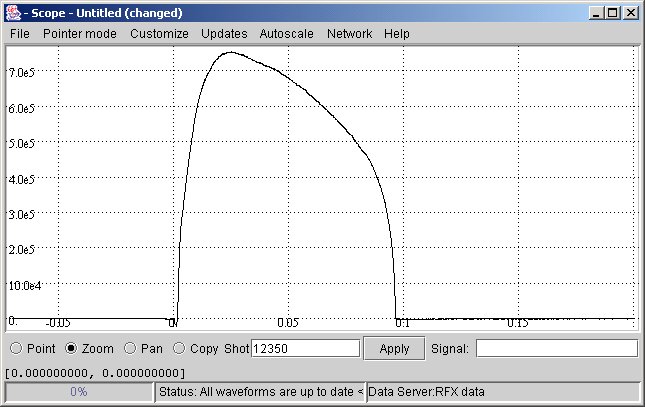
a very looooong expression (note the scroll bar). In fact acquired signals are usually made of thousands of points, and looking at the textual format of the corresponding expression is useless. Much better an interface like the following:
showing the same (evaluated) expression of the previous example.
This interface is provided by the jScope tool, a Java application for graphical waveform display. In general, jScope allows the definition of a number of panels, and associated with each panel with one or more MDSPlus expressions (usually signal references), returning an array of numbers, which are then plotted in the panel.
Contents |
How to set-up a jScope Panel
In order to start learning how using jScope, let's start from the running example of the first tutorial application presented in the first section of this tutorial.
Consider the jScope application of the tutorial entitled Scope - jScope/Tutorial_3.jscp . Click the right mouse button over the top panel and select Setup data source ... menu option:
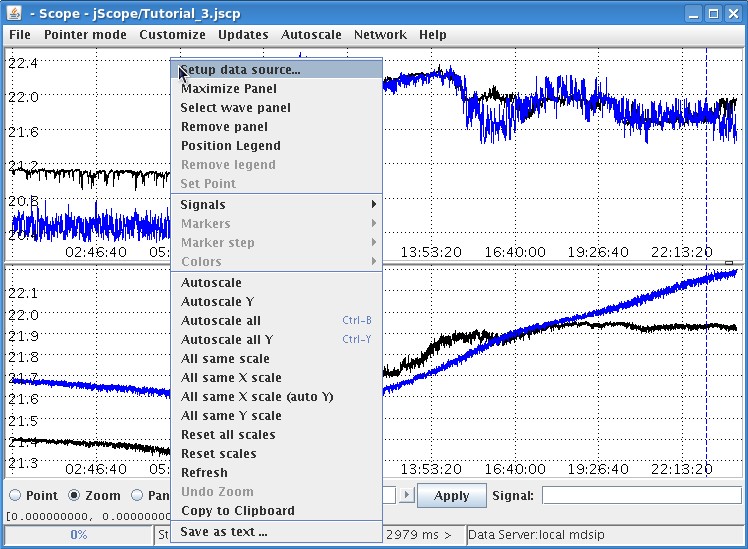
The following dialog will appear. It defines all the required information to associate one or more waveforms to the target panel:
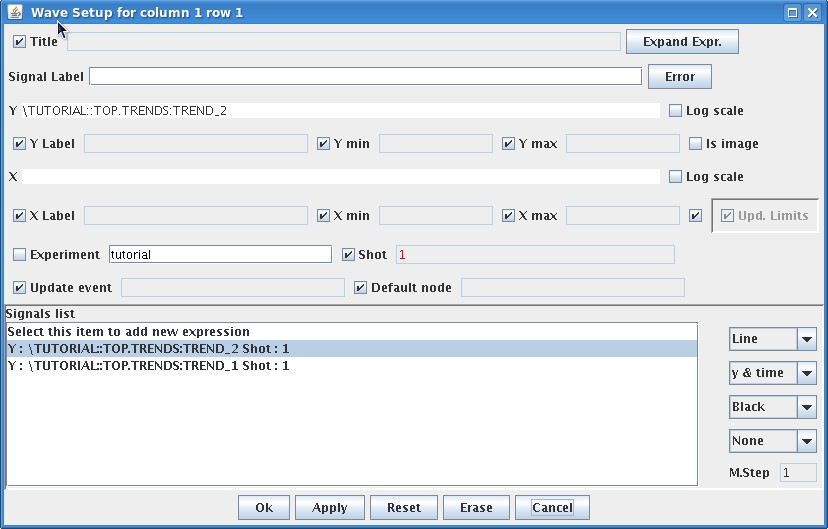
Some parameters listed in the dialog are global parameters for the targe panel, others are associated with single waveforms. If more than one waveform is specified, as in this example, click on the corresponding waveform in the Signal list for the association.
The global parameters are the following:
- Title: the title of the panel. This field, as other ones, specifies a MDSplus expression. This is useful, for example, in case the title of the panel refers to some explanatory test stored in the pulse file. In the case a string is directly specified in that field, it must be put in quotes.
- Y Label: The label associated with the Y axis (MDSplus expression)
- Y min, Y max: specify the Y value range (MDSplus expression). When any field is empty, the minimum (maximum) Y value of the signal is taken.
- X Label: The label associated with the X axis (MDSplus expression)
- Y min, Y max: specify the Y value range (MDSplus expression). When any field is empty, the minimum (maximum) X value of the signal is taken.
- Experiment: the name of the experiment from which waveforms are taken.
- Shot: the shot number.
- Update Event: the name of the MDSplus event triggering the waveform display. Events are described in the tutorial section on MDSplus events.
- Default node: the default position in the pulse file, meaningful only if relative paths are used. This field is used very seldomly.
The parameters associated with the specific waveform are the following:
- Signal Label: The label string associated with the selected signal and displayed in the signal legend. Signal legends are displayed and hidden by popup option Position Legend and Remove Legend, respectively.
- Y: the Y value of the waveform. It is expressed as a MDSplus expression which is expected to return an array.
- X: the MDSplus expression returning the X axis of the signal. This field is optional. If empty, jScope derives the X axis from the Y definition of the signal. If the expression returns a Signal data type, the X values are derived from the dimension of the signal itself (recall that the signal data type specifies samples (Y) and times(X)). If the expression returns an array, the indexes of the samples are displayed in the X axis.
A toggle button is displayed on the left of every global parameter: when checked, the value of the corresponding parameter is not directly editable in the form, but it is taken from the Global Setting parameters. Global setting is configurable via Customize->Global Setting... menu bar option. The displayed dialog, shown below, allows setting the waveform independent fields which are valid for every jScope panel.
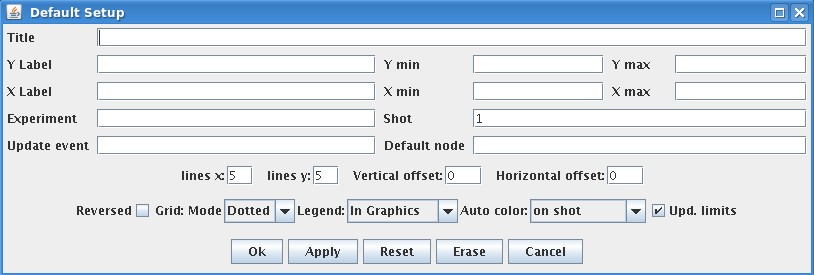
The graphical appearance of the displayed waveforms can be defined by means of the four option menus displayed on the right in the bottom Signal lists section. From top to bottom they are:
- Line option: when Line, line connecting sampling points is shown. When No Line the line is not displayed. When Step Plot, the drawn line connecting every two sampling points is horizontal.
- Dimension option: this option is used only in advanced jScope configurations involving 2D signals. For normal waveforms it is always set to y & time. We shall see that other categories of 2 D signals, such camera frames, are handled by jScope using a different setup interface.
- Color option: specifies the color of the associated waveform.
- Marker option: specifies the drawn marked for sampling points.
Other options available in the top right part of the Wave Setup dialog:
- Expand Expr. : the push button displays a larger window for typing expressions for X and Y fields. Useful for long expressions
- Log scale: logarithmic scale for X or Y axis. Very seldomly used.
- Is image: switches to frame visualization set-up. See the following sections.
- Error: defines error bars for the selected signal. When the button is pressed, a popup window is shown there the error bar for that signal can be specified. The name typed will refer to a signal with the same number of points of the associated signal yielding the error value for every point.
A useful parameter when using jScope to look at the waveform acquired in different pulse files is the Shot field in the bottom of jScope. The normal use case is to avoid defining the shot number in the Setup Data source dialog (that is, selecting the associated check button) so that jScope takes the shot number from the bottom Shot field. In this case, the shot number in that field a global number for all the displayed panels after the Apply button on its right has been pushed.
Dragging nodes from jTraverser
The normal Use Case in jScope is to define path names specifying given nodes of the pulse file. In this case, there is a quick way for defining the signals to be displayed without having to type the signal path in the tree, just dragging them from the corresponding fields in the jTraverser graphical interface into the target jScope panel. Dragging jTraverser fields brings information about both node path and experiment name, but not about the shot number that must be manually set in jScope. By default, dragging a jTraverser node overwrites the previous signal definition for that panel, unless CTRL key is being pressed, in which case, the dragged signal definition is added to the existing one for that panel. In addition, the full node paths can be copied in the clipboard by clicking <ctrl>c key over a selected jTraverser node field, and this information can be paste when defining jScope configuration.
Manipulating Waveforms
Once waveforms have been displayed in the jScope panels, they can be manipulated in order to easily retrieve useful information. jScope supports the following modes of operation, selectable via the radio buttons on the bottom left part of the window:
- Point: in this mode of operation, a crosshair is displayed in every panel and it can be dragged. Whendragging the crosshair in one panel, the crosshair shown in the other panes mode accordingly to the current position in the X axis. X and Y values are printed in the bottom status line. When multiple windows are displayed on the same panel, the crosshair is attached to the waveform which is closest to the mouse when the left mouse button is pressed.
- Zoom: in this mode of operation it is possible to zoom portions of waveforms. A combined usage of zoom and crosshair is very useful for discovering relationships among signals. A typical use case is to enlarge a portion of waveform in zoom mode in one panel to highlight an interesting phenomenon. Then, in Point mode, when the central mouse button is clicked over the enlarged signal, all the signals in the other panels are scaled at the same way, thus highlighting possible relationships among signals.
- Pan: in this mode of operation waveforms can be dragged. Useful after zooming.
- Copy: used to copy the configuration of entire panels into others. In this mode of operation, use the left mouse button to copy panel configuration and the central mouse button to paste the copied configuration into the target panel.
Other options are available in the popup menu activated by pressing the right mouse button on the target panel. Some of them are specific to the panel over which the right mouse button has been pressed, others are global, and others refer to a single waveform in the target panel. In the latter case the option is enabled only in Point mode, so that a single waveform is selected by the crosshair. Most of the options are self-explaining and are enabled only if meaningful in the current context.
jScope Configuration
The number of panels displayed by jScope can be configured via Customize->Window... menu option. When selected, the following dialog is shown
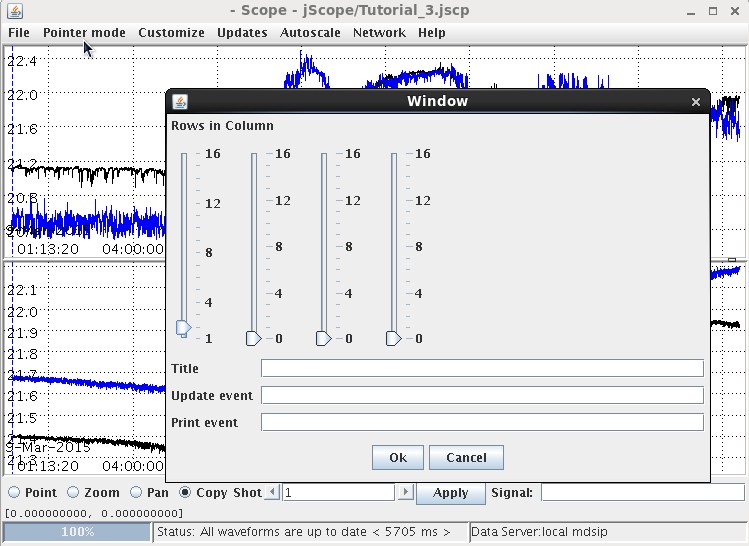
where the number of panels for each columns can be specified, up to a maximum number of 16 panels for every column (max 4). Therefore up to 64 panels can be displayed by a single jScope application.
Setting up a jScope configuration, possibly involving a large number of panels, is a lengthy process, however the current jScope configuration can be saved in a configuration file so that it can be retrieved later. This approach represents the typical usage of jScope: users prepare a set of configurations for jScope and then forget about manual jScope set-up, they simply recall their saved configurations.
To save the current jScope configuration, use ither menu option
Customize->Save current setting
or
Customize->Save current setting as...
The latter allows you specify the name or location of the configuration file (by default jScope configuration files have .jscp extension). The former is enabled when the current jScope setting has been read from a configuration file, and is used to update it after making some changes in configuration.
Configurations are loaded via either menu command
Customize->Use last saved setting
or
Customize->Use saved setting from...
The latter command allows you to choose the configuration file. By default jScope writes configuration files in the jScope directory, created in the user home directory.
Connecting jScope to data sources
jScope is a generic tool for data visualization and can be connected to a variety of data sources, not necessarily related to MDSplus. It is also possible to develop plugins for jScope so that other data formats and sources can be visualized in jScope. In order to develop a new jScope plugin for a new data source, it suffices to develop a Java class implementing the jScope.DataProvider interface.
In the large majority of application, however, jScope is used to display MDSplus data, using either data provider:
- MdsDataProvider
- LocalDataProvider
Even the two data providers give access to MDSplus data, they have an important difference which should be understood in order to use the best jScope configuration.
MdsDataProvider provides access to MDSplus data via mdsip, that is, the remote data access interface. In order to use MdsDataProvider as data source, it is necessary to have a mdsip server running in the node hosting the MDSplus pulse files. The configuration of the data provider will specify the IP address and the port number of the target mdsip server.
LocalDataProvider provides direct access to MDSplus data via a mdsip server that is activated as subprocess by the main jScope process. In this case the jScope application does not use the network as the mdsip protocol is carried out by pipe communication between jScope and the mdsip subprocess.
The jScope application is a pure Java application and, unless LocalDataProvider is used, there is no need to have any MDSplus library installed on the machine. Moreover, using either MdsDataProvider and LocalDataProvider, jScope performs on the fly data resampling in order to handle very large waveforms (up to several hundreds of MBytes of data) without running out of memory in the Java Virtual Machine.
jScope can be launched with the optional option -l or -s. When jScope is activated via the command
jScope -l
the LocalDataProvider configuration is selected. This is a convenient configuration when data are available on the same machine where jScope is run. When jScope is activated via the command
jScope -s <mdsip address[:port]>
jScope connects to the specified mdsip server. When no additional argument is passed to the jScope command, the DataProvider is selected in the graphical interface as specified below.
The available data servers are shown in Network->Servers menu. A default list is provided in jScope distribution, but it is unlikely that any will work on your specific installation, except Local (referring to LocalDataProvider). It is therefore necessary to configure one or more data providers for the specific data environment. The list of data servers can be modified and configured using the menu command Network->Edit server list.... The displayed form is shown below:
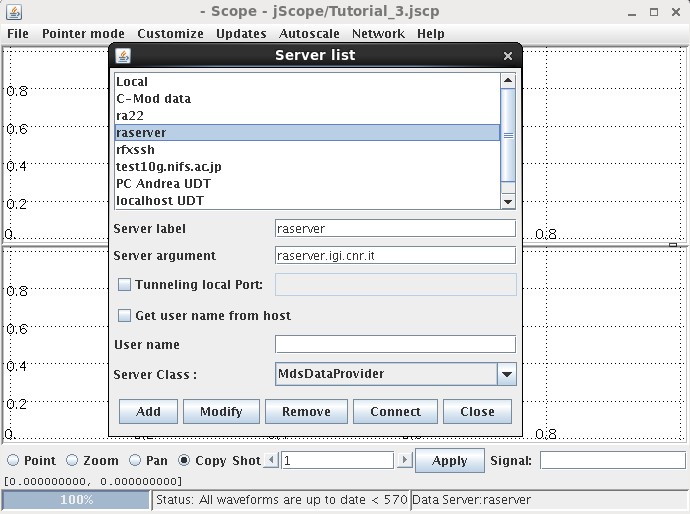
The above figure refers to the common configuration of a MdsDataProvider instance. The class is selected in the Server Class field. Server Argument defines a specific argument for the data provider which for MdsDataProvider is of the form <IP address>:<Port> (when Port is omitted, the default port number 8000 is assumed). Field Server Label specifies the name which is displayed in the Network->Servers list. Observe that multiple Data Providers can be defined in jScope allowing switching from one data source to another.
When field Tunneling local Port is enabled and a port number is specified, ssh tunneling is activated. This option is useful when the remote node hosting the mdsip server is not directly accessible via TCP/IP, but allows only ssh connection.
The current data provider definition is saved in jScope configurations, but is lost when other jScope configurations are used. For this reason, a better way to specify the supported data providers in jScope is by configuring the jScope property file as explained in the next paragraph.
The jScope property file
The jScope configuration files define a given configuration for jScope, including the defined panels and the associated waveforms. Another file, jScope.properties, contained in the jScope directory contains some general configuration definitions which hold for every new jScope application. The property file can be edited directly in jScope via menu command File->Properties... but jScope must be relaunched in order to account for the changed configuration. The property file of jScope is in particular useful for defining the list of available data providers. A sample property definition is shown below.
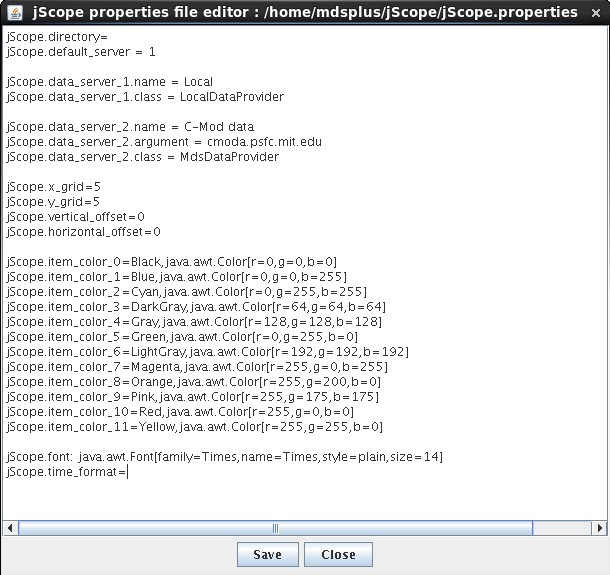
where the fields have the following meaning:
- jScope.directory: specifies an alternate directory for configuration files. The default one is $HOME/jScope/configurations.
- jScope.default_server: the index of the data provider in the server list corresponding to the default data provider. The server list defines a number N of data providers where every the ith provider is defined by the following fields
- jScope.data_server_x.name: the name of the data provider in the server list displayed by jScope
- jScope.data_server_x.class: the name of the class corresponding to the data provider
- jScope.data_server_x.argument: the (optional) argument passed for the data provider. For MdsDataProvider it is in the form <IP address of mdsip server>[:<port>]
- jScope.data_server_x.tunnel_port: the (optional) argument passed for ssh tunneling specifying the local port used for ssh tunneling.
Other fields of the property file specify some graphical appearance of jScope:
- jScope.x_grid: the preferred number of divisions in X grid
- jScope.y_grid: the preferred number of divisions in Y grid
- jScope.vertical_offset: the vertical offset between the displayed waveform and the panel border
- jScope.horizontal_offset: the horizontal offset between the displayed waveform and the panel border
- jScope.item_color_x: define the color which are incrementally assigned to multiple waveforms unless not specified in the DataSetup form
- jScope.font: the font used to display text
The last item, jScope.time_format, shown in figure is an optional one and specified the time format to be used for waveforms with associated absolute time (such as trend signals). The default one is Java Time, that is, the number of milliseconds from 1-jan-1970. jScope supports also two other representations of absolute time: VMS and EPICS. Specify VMS or EPICS in property field in jScope.time_format when handling waveforms with absolute times created using VMS or EPICS time conventions (the latter could be the MDSplus channel archiver for EPICS), respectively.
Displaying images in jScope
In addition to waveforms, jScope is able to show sequence of image frames, such as the frames acquired by a camera. A useful feature of jScope is the possibility of correlating the time associated with frames and the time associated with other displayed signals so that the frame corresponding to the currently selected time, that is the cursor time when moving the mouse over a waveform in Point mode. Referring the sample jScope application provided in the tutorial material used in the first section of this tutorial, moving the cursor over the plasma current signal (in Point modes) displays the corresponding frame in the frame sequence. In order to be displayed as a sequence of frame, the associated signal is expected to be a 3D array, where the last dimension (recall, MDSplus assumes Fortran indexing in arrays) refers to time and the first two to X and Y axis, respectively. When using the SetupDataSource Dialog to configure a jScope Panel, the is_image toggle button specifies whether a waveform or a sequence of frames is being defined. In the latter case, the Dialog changes as shown below:
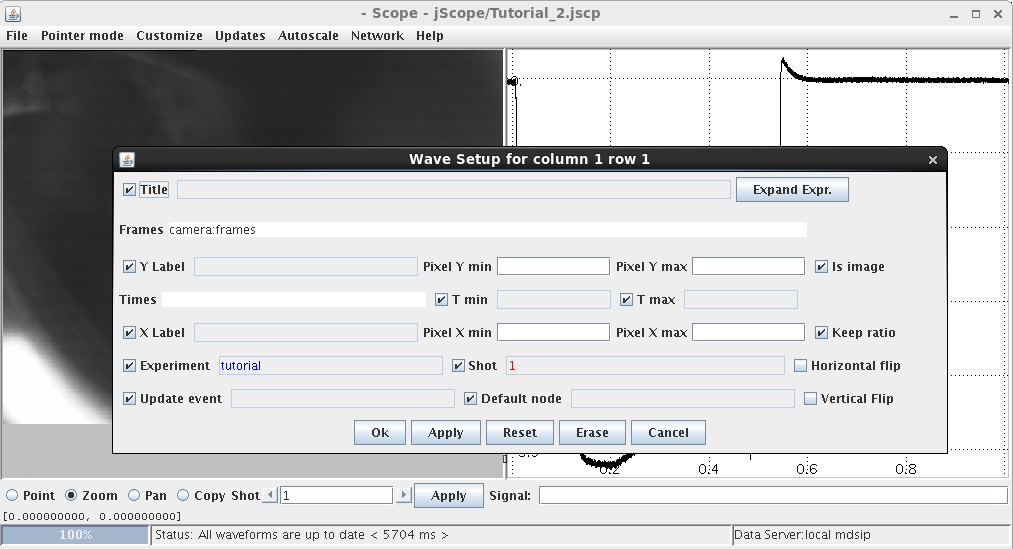
where the meaning of the changed fields is:
- Frames: specify the signal (expected to be a 3D array)
- Times: specify the time array. It may be empty in case the Frames signal has been defined as a Signal data type, specifying the times in its Dimension field.
- Pixel X min, Pixel X max: min and max values of X pixel coordinate(in case a subset of the image is to be displayed)
- Pixel Y min, Pixel Y max: min and max values of Y pixel coordinate (in case a subset of the image is to be displayed)
- Horizontal Flip, Vertical Flip: specify whether the image has to be flipped.
When displaying frames, the popup menu is changed as shown below:
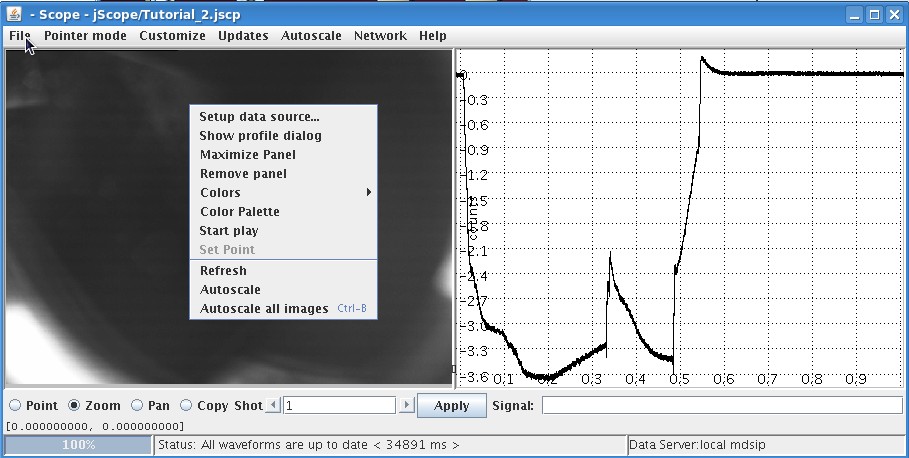
The new, frame specific menu items in the popup menu are:
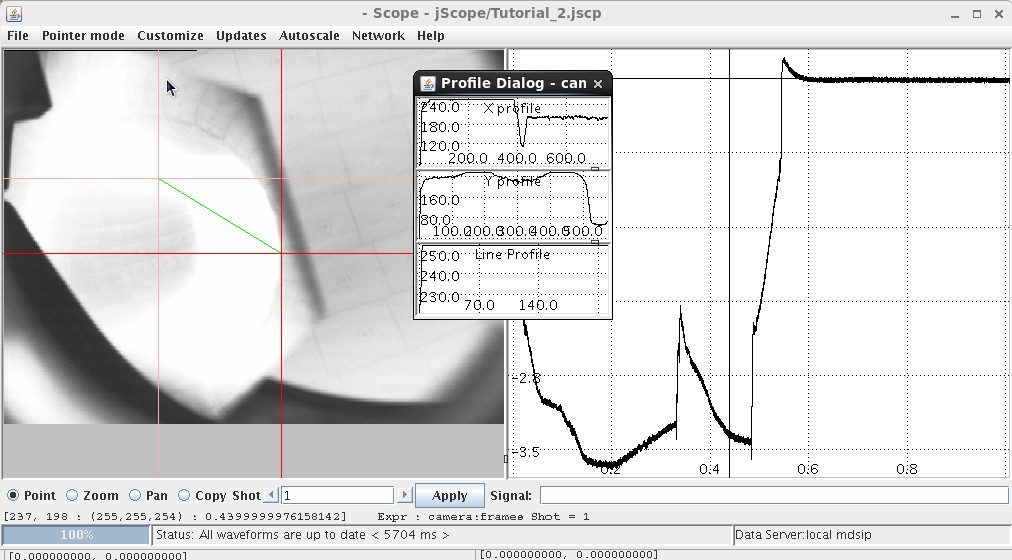
- Show profile dialog: when selected, two new small jScope panels are displayed showing the profile of the current frame along the X and Y axis, respectively
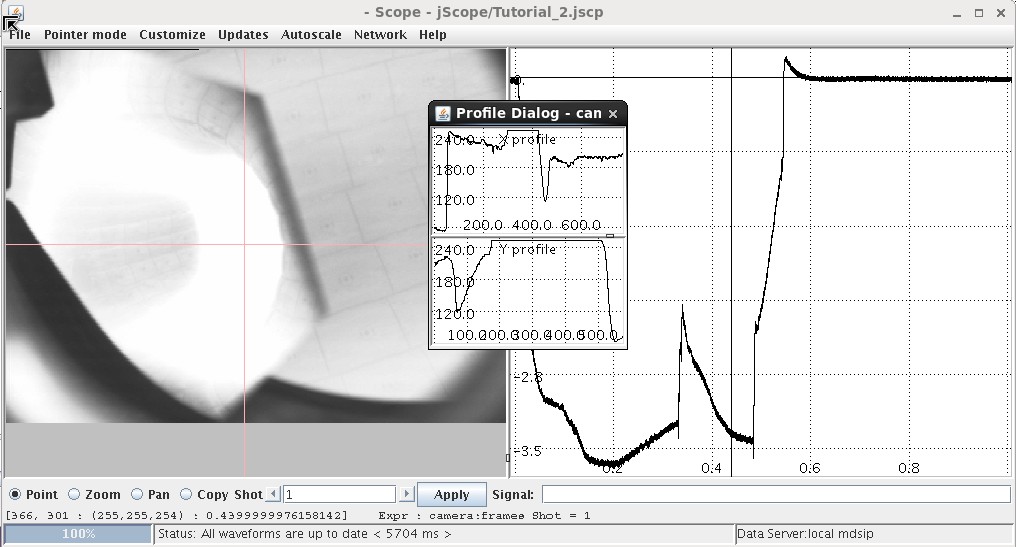
when moving the cursor over the image in Point mode, the two profiles are updated to display the current profiles.
- Select point: this option, combined with the previous one provides a third profile along the line dragged in the jScope panel as shown below
- Color palette: associates a color palette to grey scale (color images are not supported by jScope yet)
- Start play: starts showing the frames in sequence
Customizing jScope for display of non MDSplus data sources
Even if belonging to the MDSplus package, jScope can be used outside the MDSplus data framework. jScope is in fact a java package that doe not depend on MDSplus for data visualization. jScope is decoupled from data access and new data plugins can be developed in addition to the MDSplus data access components.
In addition of the basic functionality of jScope, that is, displaying signals and frames, data plugin implementations can interact with jScope in order to handle:
- Automatic refresh upon event occurrence: when specifying an update event in the panel setup form, jScope registers itself as UpdateEventListener, passing the name of the event. When the data plugin recognizes that the corresponding event has been issued (jScope is unaware of the event mechanism), it will notify jScope by calling method processUpdateEvent() for that event listener instance, this forcing a redisplay of the corresponding waveform.
- Management of large signals: when large waveforms have to be displayed, providing all the signal samples to jScope easily runs out of heap space. jScope provides some hints to the data plugin to handle dynamic data resampling. When requested for data the first time for a given signal, jScope communicates the time limits of the requested waveform (if any) and expects an indicator of the resolution of the returned signal. If the data plugin decides to return a subsampled version of the signal, it will indicate it giving a resolution value (i.e. the subsampling frequency). jScope uses this information when a displayed waveform is zoomed in order to decide whether requesting new data at higher resolution. The method used in this case (WaveData.getDataAsynch()) is expected to return soon in order not to block the graphical interface, and the data plugin will notify jScope via a publish-subscribe mechanism when the requested data are available (with a new resolution value). In order to disable the dynamic resolution management, the data provider will return Double.MAX_VALUE ar resolution indicator the first time the signal data are requested
- Live display: if the data source is continuously generating data, jScope visualization can be updated asynchronously. Notification of new data for a given signal is carried out using the same publish-subscribe mechanism used for the dynamic resampling. jScope reguster itself as WaveDataListener and the data plugin will call WaveDataListener.dataRegionUpdated() from a separate thread to notify jScope of the availability of new data. jScope will update the displayed waveform, or display the last part of the waveform as a strip chart if zooming a portion of the current signal up to the maximum X value.
In order to develop a new data plugin for jScope it is necessary to provide an implementation of the following interfaces:
- DataProvider: the class implementing the top functionality and the event management. When requested for signal or frame data this class does not return data arrays directly, but will return an instance implementing interface WaveData and FrameData for signals and frames, respectively.
- WaveData: providing the required interface for a single waveform display.
- FrameData: providing the required interface for the display of a sequence of frames in the jScope panel.
