From MdsWiki
| Revision as of 13:41, 24 July 2015 (edit) Manduchi (Talk | contribs) ← Previous diff |
Revision as of 13:46, 24 July 2015 (edit) Manduchi (Talk | contribs) Next diff → |
||
| Line 10: | Line 10: | ||
| <font face="Arial">This interface is provided by the '''jScope''' tool, a Java application for graphical waveform display. In general, jScope allows the definition of a number of panels, and associated with each panel with one or more MDSPlus expressions (usually signal references), returning an array of numbers, which are then plotted in the panel.</font><br /> | <font face="Arial">This interface is provided by the '''jScope''' tool, a Java application for graphical waveform display. In general, jScope allows the definition of a number of panels, and associated with each panel with one or more MDSPlus expressions (usually signal references), returning an array of numbers, which are then plotted in the panel.</font><br /> | ||
| + | ===How to set-up a jScope Panel=== | ||
| In order to start learning how using jScope, let's start from the running example of the first tutorial application presented in [http://www.mdsplus.org/index.php?title=Documentation:Tutorial:QuickOverview%20&open=38101832318169843162415089&page=Documentation%2FThe+MDSplus+tutorial%2F+A+Quick+Tour+over+MDSplus+Basic+Concepts the first section] of this tutorial.<br /> | In order to start learning how using jScope, let's start from the running example of the first tutorial application presented in [http://www.mdsplus.org/index.php?title=Documentation:Tutorial:QuickOverview%20&open=38101832318169843162415089&page=Documentation%2FThe+MDSplus+tutorial%2F+A+Quick+Tour+over+MDSplus+Basic+Concepts the first section] of this tutorial.<br /> | ||
| Consider the jScope application of the tutorial entitled Scope - jScope/Tutorial_3.jscp . Click the right mouse button over the top panel and select ''Setup data source ...'' menu option:<br /><br /> | Consider the jScope application of the tutorial entitled Scope - jScope/Tutorial_3.jscp . Click the right mouse button over the top panel and select ''Setup data source ...'' menu option:<br /><br /> | ||
| Line 32: | Line 33: | ||
| * '''X''': the MDSplus expression returning the X axis of the signal. This field is optional. If empty, jScpope derives the X axis from the Y definition of the signal. If the expression returns a Signal data type, the X values are derived from the dimension of the signal itself (recall that the signal data type specifies samples (Y) and times(X)). If the expression returns an array, the indexes of the samples are displayed in the X axis. | * '''X''': the MDSplus expression returning the X axis of the signal. This field is optional. If empty, jScpope derives the X axis from the Y definition of the signal. If the expression returns a Signal data type, the X values are derived from the dimension of the signal itself (recall that the signal data type specifies samples (Y) and times(X)). If the expression returns an array, the indexes of the samples are displayed in the X axis. | ||
| - | A toggle button is displayed on the left of every global parameter: when checked, the value of the corresponding parameter is not directly editable in the form, but it is taken from the Global Setting parameters. Global setting is configurable via ''Customize->Global Setting...'' menu bar option. The displayed dialog, shown below, allows setting the waveform independent fields which are valid for every jScope panel.<br /> | + | A toggle button is displayed on the left of every global parameter: when checked, the value of the corresponding parameter is not directly editable in the form, but it is taken from the Global Setting parameters. Global setting is configurable via ''Customize->Global Setting...'' menu bar option. The displayed dialog, shown below, allows setting the waveform independent fields which are valid for every jScope panel.<br /><br /> |
| - | [[Image:GlobalSettings.jpg]]<br /> | + | [[Image:GlobalSettings.jpg]]<br /><br /> |
| - | + | The graphical appearance of the displayed waveforms can be defined by means of the four option menus displayed on the right in the bottom Signal lists section: | |
| + | * '''Line option''': when ''Line'', line connecting sampling points is shown. When ''No Line'' the line is not displayed. When ''Step Plot'', the drawn line connecting every two sampling points is horizontal. | ||
| + | |||
Revision as of 13:46, 24 July 2015
jScope is a MDSplus tool providing a sophisticated graphical interface to acquired waveforms.
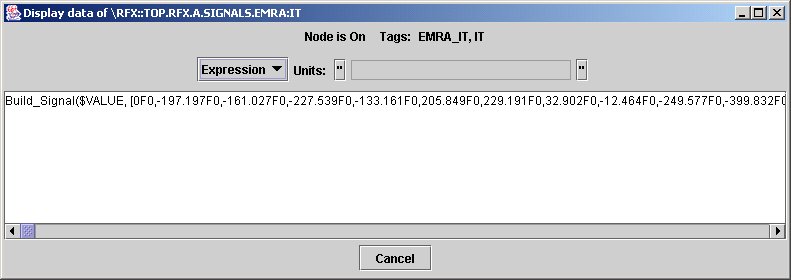
We know now that a MDSplus tree can contain several kinds of data, among which arrays and signals. If we use jTraverser to look at the content of a node containing an acquired signal, we would see something like the following:
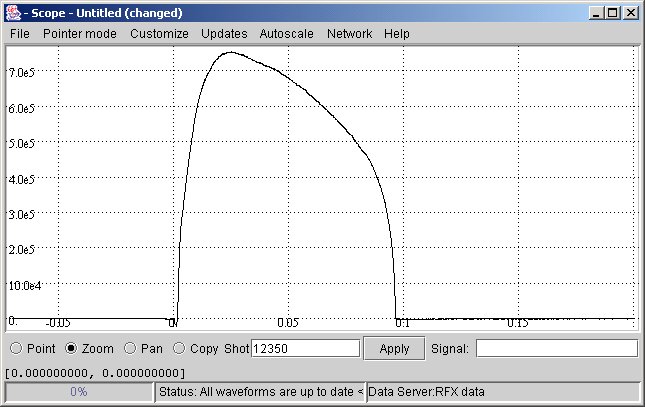
a very looooong expression (note the scroll bar). In fact acquired signals are usually made of thousands of points, and looking at the textual format of the corresponding expression is useless. Much better an interface like the following:
showing the same (evaluated) expression of the previous example.
This interface is provided by the jScope tool, a Java application for graphical waveform display. In general, jScope allows the definition of a number of panels, and associated with each panel with one or more MDSPlus expressions (usually signal references), returning an array of numbers, which are then plotted in the panel.
How to set-up a jScope Panel
In order to start learning how using jScope, let's start from the running example of the first tutorial application presented in the first section of this tutorial.
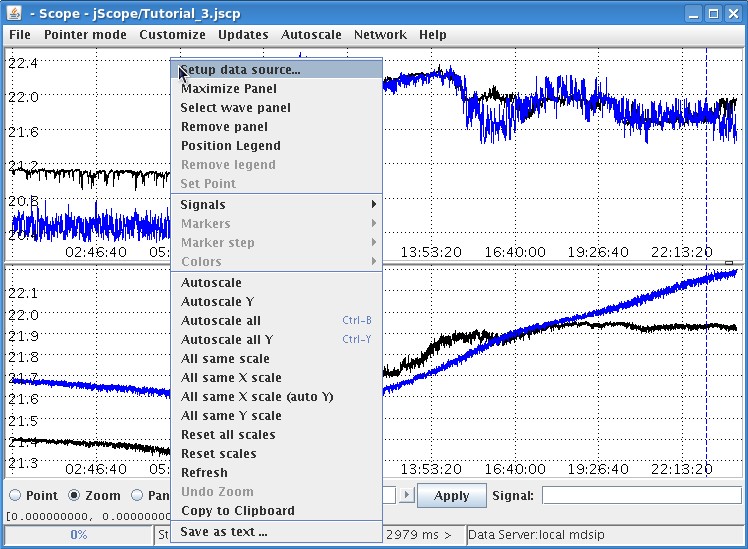
Consider the jScope application of the tutorial entitled Scope - jScope/Tutorial_3.jscp . Click the right mouse button over the top panel and select Setup data source ... menu option:
The following dialog will appear. It defines all the required information to associate one or more waveforms to the target panel:
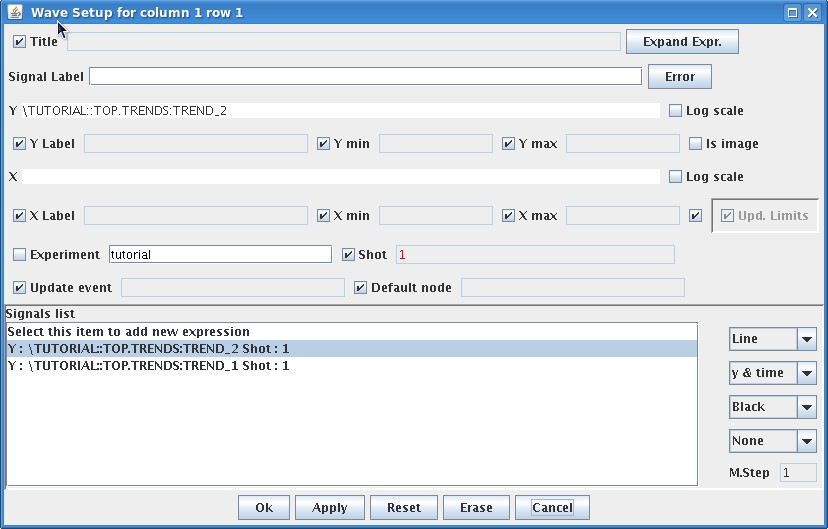
Some parameters listed in the dialog are global parameters for the targe panel, others are associated with single waveforms. If more than one waveform is specified, as in this example, click on the corresponding waveform in the Signal list for the association.
The global parameters are the following:
- Title: the title of the panel. This field, as other ones, specifies a MDSplus expression. This is useful, for example, in case the title of the panel refers to some explanatory test stored in the pulse file. In the case a string is directly specified in that field, it must be put in quotes.
- Y Label: The label associated with the Y axis (MDSplus expression)
- Y min, Y max: specify the Y value range (MDSplus expression). When any field is empty, the minimum (maximum) Y value of the signal is taken.
- X Label: The label associated with the X axis (MDSplus expression)
- Y min, Y max: specify the Y value range (MDSplus expression). When any field is empty, the minimum (maximum) X value of the signal is taken.
- Experiment: the name of the experiment from which waveforms are taken.
- Shot: the shot number.
- Update Event: the name of the MDSplus event triggering the waveform display. Events are described in the tutorial section on MDSplus events.
- Default node: the default position in the pulse file, meaninful only if relative paths are used. This field is used vary seldomly.
The parameters associated with the specific waveform are the following:
- Signal Label: The label string associated with the selected signal and displayed in the signal legend. Signal legends are displayed and hidden by popup option Position Legend and Remove Legend, respectively.
- Y: the Y value of the waveform. It is expressed as a MDSplus expression which is expected to return an array.
- X: the MDSplus expression returning the X axis of the signal. This field is optional. If empty, jScpope derives the X axis from the Y definition of the signal. If the expression returns a Signal data type, the X values are derived from the dimension of the signal itself (recall that the signal data type specifies samples (Y) and times(X)). If the expression returns an array, the indexes of the samples are displayed in the X axis.
A toggle button is displayed on the left of every global parameter: when checked, the value of the corresponding parameter is not directly editable in the form, but it is taken from the Global Setting parameters. Global setting is configurable via Customize->Global Setting... menu bar option. The displayed dialog, shown below, allows setting the waveform independent fields which are valid for every jScope panel.
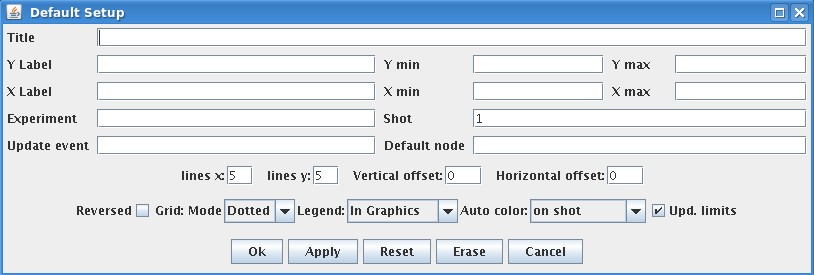
The graphical appearance of the displayed waveforms can be defined by means of the four option menus displayed on the right in the bottom Signal lists section:
- Line option: when Line, line connecting sampling points is shown. When No Line the line is not displayed. When Step Plot, the drawn line connecting every two sampling points is horizontal.
We shall describe here very briefly the features of jScope concentrating more on the way jScope connects to a data source. Basically, jScope connects a panel to a set of signals by means of the Setup Data Dialog, activated by selecting the pop-up option Setup data source... getting the following dialog:
The setup data dialog has several fields, mostly optionals. The field Y is mandatory and defines the expression to be evaluated. In the above example, as in most cases, the expression is a reference (a tag name here) to a node of a MDSplus tree. If the X field is not specified, jScope defines as the X axis either the sequence of integer numbers, in the case the evaluation of the Y expression returns an array, or the time values of the specified signal in the case the evaluation of the Y expression returns a signal (i.e. the MDSplus data type specifying both an Y and a X axis).
In the above example, two other fields have been filled: the experiment, i.e. the name of the MDSPlus tree containing the data to be displayed, and the shot number.
You will note also that a checkbox is associated with every field. When selected, the checkbox indicates that the value of the corresponding field is retrieved from the global settings. The global settings form is activated via the Customize->Global Settings... option. In particular, it is convenient to let the default setting of the shot number, and then to type the actual shot number (which is often changed) in the bottom Shot: label of jScope.
So far we have seen how to connect a jScope panel to one (or more) signals stored in a MDSplus tree. This is however not enough for a complete specification of the signal. In fact we need to define also where is the MDSplus tree. The location of the MDSplus tree is specified by defining an appropriate Data Server using the Network->Servers pulldown menu.
We shall see in the following sections how MDSplus data are exported. We anticipate here that MDSplus data hosted on a system can be exported by running an application called mdsip. This application exports the content of the local trees over TCP/IP top any connected client running jScope. When data is accessed locally, and no mdsip server is active, jScope reads local data using the local MDSplus data access routines. In this case it is necessary to define the Local Data Server. As in this case jScope links directly to the MDSplus libraries, you need to have MDSplus installed on your machine, and an appropriate definition of the environment variable PATH (for windows) or LD_LIBRARY_PATH (for Unix), defining the directory containing the MDSplus libraries (usually \Program Files\mdsplus if you installed MDSplus on windows, or /usr/local/mdsplus/lib on Unix).
When data is accessed on a remote node, there is no need of installing the MDSPlus libraries on the machine running jScope (which is this case is a pure Java application), as jScope handles directly in Java the communication protocol.
To connect jScope on a MDSplus tree on another machine the following steps are required:
- Start a mdsip server on the machine hosting the MDSplus tree. Let's assume that you are using the default port 8000.
- Edit a new Data Server to be added in the Server list of jScope, through option Network->Edit server list...
- The following for is activated:

Fill fields Server label: with a name of your choice, Server argument: with the IP address and port of the machine running the mdsip server, separated by a colon, and select MdsDataProvider as Server class. Once you have pressed the Add button, your data server is added to the server list of jScope, and once you have selected the newly created server in the servers list, jScope is connected to your data source via the mdsip server (the currently selected data server is displayed in the bottom right label of jScope).
You may wonder whether it is necessary to repeat all those steps each time jScope is started again. The answer is no, of course, and there are two ways for storing this information:
- Once you have defined your data server, and connected each panel to one (or more signals), you may save the current configuration in a configuration file using the Customize->Save Current setting as... option. When a jScope is started, you can retrieve the saved configuration by means of the Customize->Use saved settings from... option.
- You can permanently add your data server to the server list of jScope (as well as change this list) by editing the properties file used by jScope. You can edit this file directly within jScope by selecting the File->properties... option. You add the above definition of your data serer by writing the following lines (where n is the index position of your server in the server list):
jScope.data_server_<n>.name = My server
jScope.data_server_<n>.argument = 130.237.47.75:8000
jScope.data_server_<n>.class = MdsDataProvider
To learn more on jScope
You can find a complete description by selecting the Help->About jScope menu option, or through this link)
